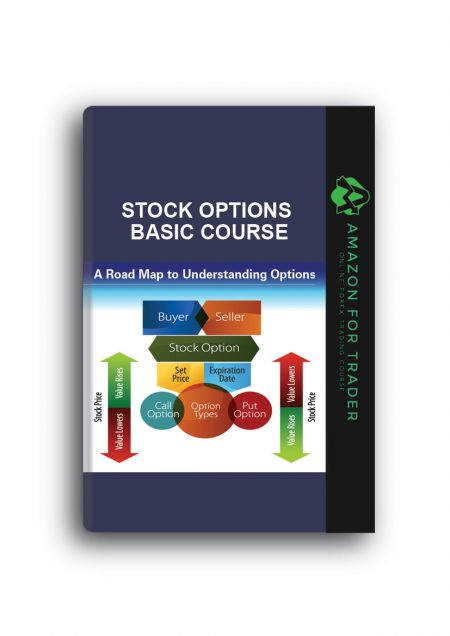
 STOCK OPTIONS BASICS COURSE - Follow Me Trades
 Chris Farrell – 4 Week Fast Track
 EZEETRADER – DIVERGENT SWING TRADING 2015
 Craig Harris – Forex Trading Advice & Intro to The Natural Flow (craigharris-forex-education.com)
 Christodoulos Floudas, Panos Pardalos – Encyclopedia of Optimization 2nd Ed
 Rj - Rich Jerk Program
 Options University – Ron Ianieri – Advanced Options Strategies
 Francis Botto – Dictionary of E-Business
 John Schaub – 2013 home study course: Retirement Investing
 TOSHKO RAYCHEV – NEW SCIENCE OF FOREX TRADING
 Udemy - Unreal Engine C++ Developer: Learn C++ And Make Video Games
 Evercoach – Being an Exponential Coach with Rich Litvin
 OMG Sales Machine – The Road to $30k/Mo
 James C.Spall - Introduction to Stochastic Search and Optimization
 Yousef Khalidi - Euro Invasion Shopify Strategy
 ACTIVEDAYTRADER – BOND TRADING BOOTCAMP
 Dan Miller – The Forex Legacy (theforexlegacy.com)
 Peter Krass – The Book of Investing Wisdom
 Larry Williams - The Right Stock at the Right Time. Prospering in the Coming Good Years
Description
Larry Williams – How to Trade Better
*WHEN TO GET IN – WHEN TO GET OUT – TREND CHANGE SIGNAL*
There are probably as many ways to determine trend change as there are traders! In this day of computers, the fancy math boys have really beaten the numbers up to develop a trend change mechanism. In a very large way trend change is a moot point, as it just tells us what has transpired with no assurance it will continue in the future.
MY CENTRAL THESIS:
Here it is, conditions cause major up and down moves, trend change. Without the conditions being present, trend change has little validity. Back a trend change with conditions and you get rip roaring bull/bear markets.
I would like to think you now understand some of these conditions, such as the Commercials (i.e. Commitment of Traders Report Commericials). Let me add to your arsenal a trend change tool. The tool illustrated in the following charts is a simple 18-day moving average of closing price, that’s it, nothing fancy here.
Sugar Chart 1
Notice the dots…notice how they appear at important trend change points.
The dots on the chart appear when there have been two days totally above the average for a buy and two days totally below the average for sells. This is the set up for the change. Then some select short-term buy/sell signals can be used for your entry. Markets do not alway trend like this, there is risk in trading. Results will vary and no technique can guarantee making money. What you are seeing here is a tool I have used for 30 years.
I teach more specific entries in my Sure Thing Commodity Trading online course, but as you can see, there is power to these points.
For example, I have taken two big trend markets – the up move in T Bonds and the down move in Lumber, as well as a choppy one, Gold.
Treasury Bonds Chart
Gold Chart 3
Dollar Index Chart 4
As you will note the appearance of the dots usually kick off trend changes of consequence. (But not always) That’s the good news for the start of the year; we can determine trend change. This is not a new phenomena; the following charts are from 2000 (note the changes in software since then as well!)…I used these charts back then, to illustrate the same point I am making in 2011.
Sugar Chart 5
Wheat Chart 6
Larry Williams, How to Trade Better, Download How to Trade Better, Free How to Trade Better, How to Trade Better Torrent, How to Trade Better Review, How to Trade Better Groupbuy.


Reviews
There are no reviews yet.