 ACTIVEDAYTRADER – BOND TRADING BOOTCAMP
 Dan Miller – The Forex Legacy (theforexlegacy.com)
 WEEKLY WIRES CLASS - SIMPLER TRADING
 Alpesh Patel Package ( Discount 20% )
 Carol Alexander – Market Risk Analysis Vol. III. Pricing, Hedging & Trading Financial Instruments
 OPTIONPIT – MAXIMIZING PROFITS WITH WEEKLY OPTIONS TRADING
 Frank J.Fabozzi, Pamela P.Peterson - Financial Management & Analysis
 Craig Harris – Forex Trading Advice & Intro to The Natural Flow (craigharris-forex-education.com)
 Donald D.Hester – The Evolution of Monetary Policy & Banking in the US
 Dr. Mircea Dologa – Theory & Practice. Integrated Pithfork Analysis
 The Real Estate Agent’s Business Planner - Practical Strategies For Maximizing Your Success
 Oiltradingacademy - Oil Trading Academy Code 1 + 2 + 3 Video Course
 Chris Chico – Flipanywhere Academy Accelerator
 M.Hazewinkel – HandBook of Algebra (Vol I & II)
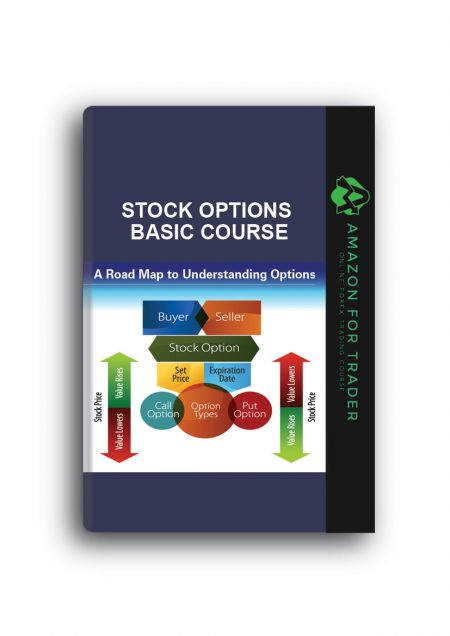 STOCK OPTIONS BASICS COURSE - Follow Me Trades
 Udemy - Options Trading Basics (3-Course Bundle)
 Shirley Coleman – Statistical Practice in Business & Industry
 Thomson Learning – The Video Guide For Spss 13
 Peter Krass – The Book of Investing Wisdom
 Raymond Merriman – The Ultimate Book on Stock Market Timing (VOL II) – Geocosmic Correlations to Investment Cycles
 Jack Schwager – A Complete Guide to the Futures Markets
 Lars Tvede – The Psychology of Finance
 Jack L.Treynor – Treynor on Institutional Investing
 Udemy - The Complete Junior To Senior Web Developer Roadmap (2019)
 Alessio Rastani - Ultimate Guide to Stock Investing
 ANDREA UNGER – MASTER THE CODE & GO LIVE
 Raymond Merriman – The Ultimate Book on Stock Market Timing (VOL I) – Cycles and Patterns in the Indexes
 Hrishikesh Vinod, Derrick Reagle – Preparing for the Worst Incorporating Downside Risk in Stock Market Investments
 Udemy - Swift & Firebase Building An Impressive Realtime Drawing App
 INVESTOPEDIA - TRADING FOR BEGINNERS
 Udemy - PHP – Send And Receive Mobile Text Messages (SMS)
 Harry Schultz – Bear Market Investing Strategies
 ICHIMOKU CLOUD TRADING COURSE - FOLLOWMETRADES
 Udemy - BUSINESS Online Marketing Business: Create Your Agency, Step-By-Step
 ORDERTFLOWS - THE ORDERFLOWS DELTA TRADING COURSE
 Lindaraschke - Classic Trading Tactics: Theory and Practice
 William C.Garrett – Investing for Profit with Torque Analysis of Stock Market Cycles
 The PMP Exam - How to Pass on Your First Try
 Udemy - Selenium WebDriver With C# For Beginners + Live Testing Site
 SmartFolio 3.2.4 Individual License
 Reilly Brown – Investment Analysis & Portfolio Management
 ACPARE – Condominium Investing Mastery
 FOLLOWMETRADES – MASTER TRADER COURSE
 Billy Gene – School of Geneius – Youtube Ads Workshop
 Elliottwave - How to Trade the Highest Probability Opportunities - Price Bars and Chart Patterns
 Tobin Smith – ChangeWave Investing 2.0 Picking the Next Monster Stocks While Protecting Your Gains in a Volatile Market
 Jimmy D Brown - 10 Day Copywriting Challenge
 The Art of Strategy - A Game Theorist’s Guide to Success in Business and Life
 Vick Strizheus - High Traffic Academy 2.0
 Jay Papasan - The ONE Thing The Surprisingly Simple
 William N.Goetzmann – An Introduction to Investment Theory
 Charles Jackson – Active Investment Management
 Hendrik S.Houthakker – The Economics of Financial Markets
 Joe DiNapoli – The Practical Application of Fibonacci Analysis to Investment Markets
 Sam Ovens – Consulting Accelerator 2018
 Frank J.Fabozzi – The Handbook of Financial Instruments
 Lawrence G.McMillan – Options as a Strategic Investment
 Tom Yeomans – Trading the News Seminar
 Wallstreetprep - Excel Crash Course
 Mark Minervini – Think & Trade Like a Champion. The Secrets, Rules & Blunt Truths of a Stock Market Wizard, 2017
 Ruth Miller & Iam Williams – The Solar Guidance System
 Damian Mason - Do Business Better
 David Abner – The ETF Handbook. How to Value and Trade Exchange Traded Funds
Description
Chicago Board of Trade – Market Profile
A Market Profile is an intra-day charting technique (price vertical, time/activity horizontal) devised by J. Peter Steidlmayer, a trader at the Chicago Board of Trade (CBOT), ca 1959-1985. Steidlmayer was seeking to evaluate market value as it developed in the day time frame. Steidlmayer’s charts displayed a bell shape, fatter at the middle prices, with activity trailing off at the higher and lower prices. In this structure he recognized the ‘Normal’, gaussian distribution he had met with in college statistics, (3).
The Market Profile graphic was introduced to the public in 1985 as a part of a CBOT product, the CBOT Market Profile (CBOTMP1) (2). CBOTMP1 included the new Liquidity Data Bank (LDB) data; end-of-day clearings, identified by the class of trader in the pits ( (1) local, (2) commercial, (3) members filling for other members and (4) members filling orders for the public). The Profile was proposed as a tradingmethodology for using these new data. CBOTMP1 advertised the Profile/LDB as the way to ‘Improve Performance’. It is described as “the only variable-cost ticker service in the commodities industry.”
The promotional material says the Profile is to be the link between the CBOT data and the market. A Profile graphic is to be used to tell “what the market is doing”; the LDB data is for finding the market’s ‘condition’. As a part of the data-display connection in CBOTMP1, the price of the peak cleared volume is identified as the Point of Control (POC). Following the normal distribution analogy, the central seventy percent of trading activity about POC (+/- one standard deviation) is termed the ‘Value Area’.
Section Headings for “CBOT Market Profile, 1986” are:
- Using the CBOT Market Profile to Improve Performance
- The Profile: The link Between CBOT Data and the Market
- Part I What the Market is Doing: The Market Profile Graphic
- Part II The Condition of the Market: Liquidity Data Bank
- Appendix
In 1987, Professor Thomas P. Drinka of Western Illinois University launched the first Market Profile® course in academia. As of 2010, Western remains as the premiere and only academic institution to offer such a course as part of curriculum.
A new and expanded 335 page CBOT Market Profile manual, CBOTMP2, was released in 1991, (5). In this volume the first five sections are devoted to profile analysis. The last section discusses LDB data. Unlike CBOTMP1, there is no emphasis on a Market Profile ticker product. In the period 1985 – 1991 the profile concept caught on with the public (in one Chicago Tribune article Steidlmayer was identified as “the man who knows where the market is going”).
Steidlmayer and Kevin Koy started Market Logic School to teach profile trading. CBOT gave up on marketing the Liquidity Data Bank directly to the public (CISCO Futures became their vendor). Public access to tick data increased greatly so that profiles could be constructed intra-day (LDB data was still end of day). It was becoming clear that pit trading‘s days were numbered. By 1991 it was obvious that the focus was on the profile technology and less on the database used to support the calculations. Hence the change in emphasis on the Profile vs the LDB data in CBOTMP2.
In both CBOTMP1 and CBOTMP2 ‘Market Profile’ occurs in the name, but it is hard to find a definition of exactly what a Market Profile is. Many, many examples are given in both publications. A working definition from Mind Over Markets (9) is: “the market’s price activity recorded in relation to time in a statistical bell curve“. Added to this would be a definition of the price and the marker, a ‘TPO’ (time-price opportunity), with TPO defined in CBOTMP1 as: “opportunity created by the market at a certain price at a certain time”. For example:
101150 A A = 08:00 to 08:29101125 AB B = 08:30 to 08:50101100 B C = 09:00 to 09:29101075 BC
Letters identify time, as does position (A’s in one column, B’s in the next, etc. A, B, C are TPO’s (that price occurred).
Section Headings for “CBOT Market Profile, 1991”
- Reading the Market Profile Graphic
- Profiles for Long Term Trends
- Perception of Value Fuels Market Activity
- Market Profile Data and the Distribution Process
- Market Profile Tools to Support Trading Decisions
- Liquidity Data Bank Volume Analysis
Volume is said to identify signs of continuation or change, to infer the directional facilitation of trade, but “volume data, by itself, is meaningless”. The reason given is that “it is essential to know what market participants are doing”. Many ‘profile readings’ are shown in both CBOTMP1 and CBOTMP2, inferring who is trading what and what message they are sending. One method, apparently, is to see if volume is increasing to the upside or downside intra-day. It should be noted that the LDB data discussed here is end of day. Some time later the CBOT began releasing clearings during the day on the half hour. These clearings when compared to tick data indicate an approximately half hour delay. It is not explained just how reading trade facilitation with delayed data is effected.
At the beginning of the day the first hour of trading creates a range (the Initial Balance). Then, as additional information on the day’s trading continued, certain chart formations, called day types, are recognized. These formations have names (1), (2), such as ‘neutral day’, non-trend day, trend day, etc. Another concept, the ‘third standard deviation’ or Steidlmayer Distribution has been discussed (1) possibly in support of day types. The Steidlmayer Distribution begins as the current, equilibrium, distribution moves out of equilibrium (1, p 175).
Chicago Board of Trade, Market Profile, Download Market Profile, Free Market Profile, Market Profile Torrent, Market Profile Review, Market Profile Groupbuy.
Reviews
There are no reviews yet.